PHOEBE Research#
What is PHOEBE?#
PHOEBE (PHysics Of Eclipsing BinariEs) is an open-source Python package for modeling eclipsing binary systems from observational data.
This project used photometric and spectroscopic inputs to estimate binary-star parameters and present reproducible fitting results.
PHOEBE eclipsing binary model visualization.#
Objective#
This work focused on an inverse problem: estimating unknown system parameters from real observations.
The primary goal was to balance fit quality, computational cost, and parameter uncertainty across large datasets.
MCMC Parameter Fitting#
To solve the inverse problem, I employed a Markov Chain Monte Carlo (MCMC) approach using the emcee Python package. The method uses an ensemble of “walkers” that explore the parameter space, converging on the most probable values for the system parameters.
Parameters estimated:
Orbital inclination ($incl$)
Primary stellar radius ($r_1$)
Secondary stellar radius ($r_2$)
Secondary effective temperature ($T_{\text{eff},2}$)
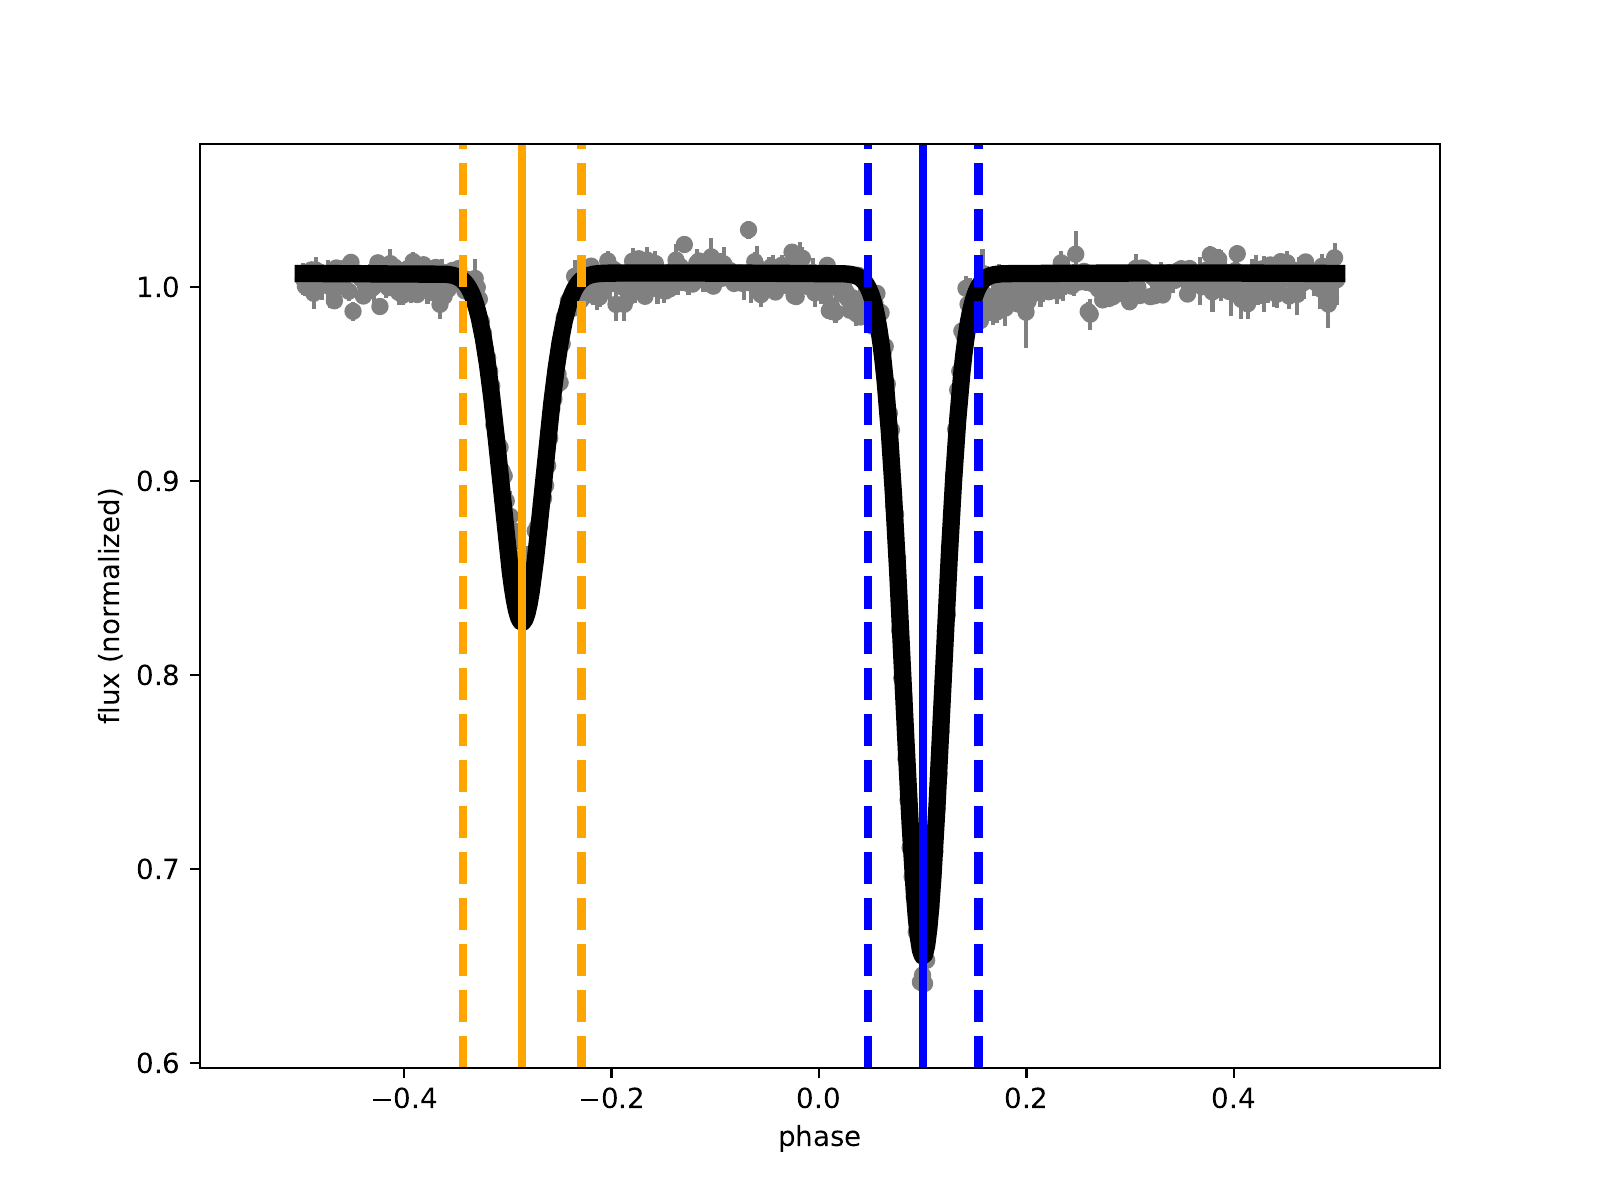
Light Curve Geometry#
The simulated binary system generates light curves that encode information about the system’s orbital geometry and stellar properties.
Corner Plot#
The corner plot visualizes the posterior probability distributions and correlations between all fitted parameters. Well-constrained parameters show tight distributions centered on the true values.
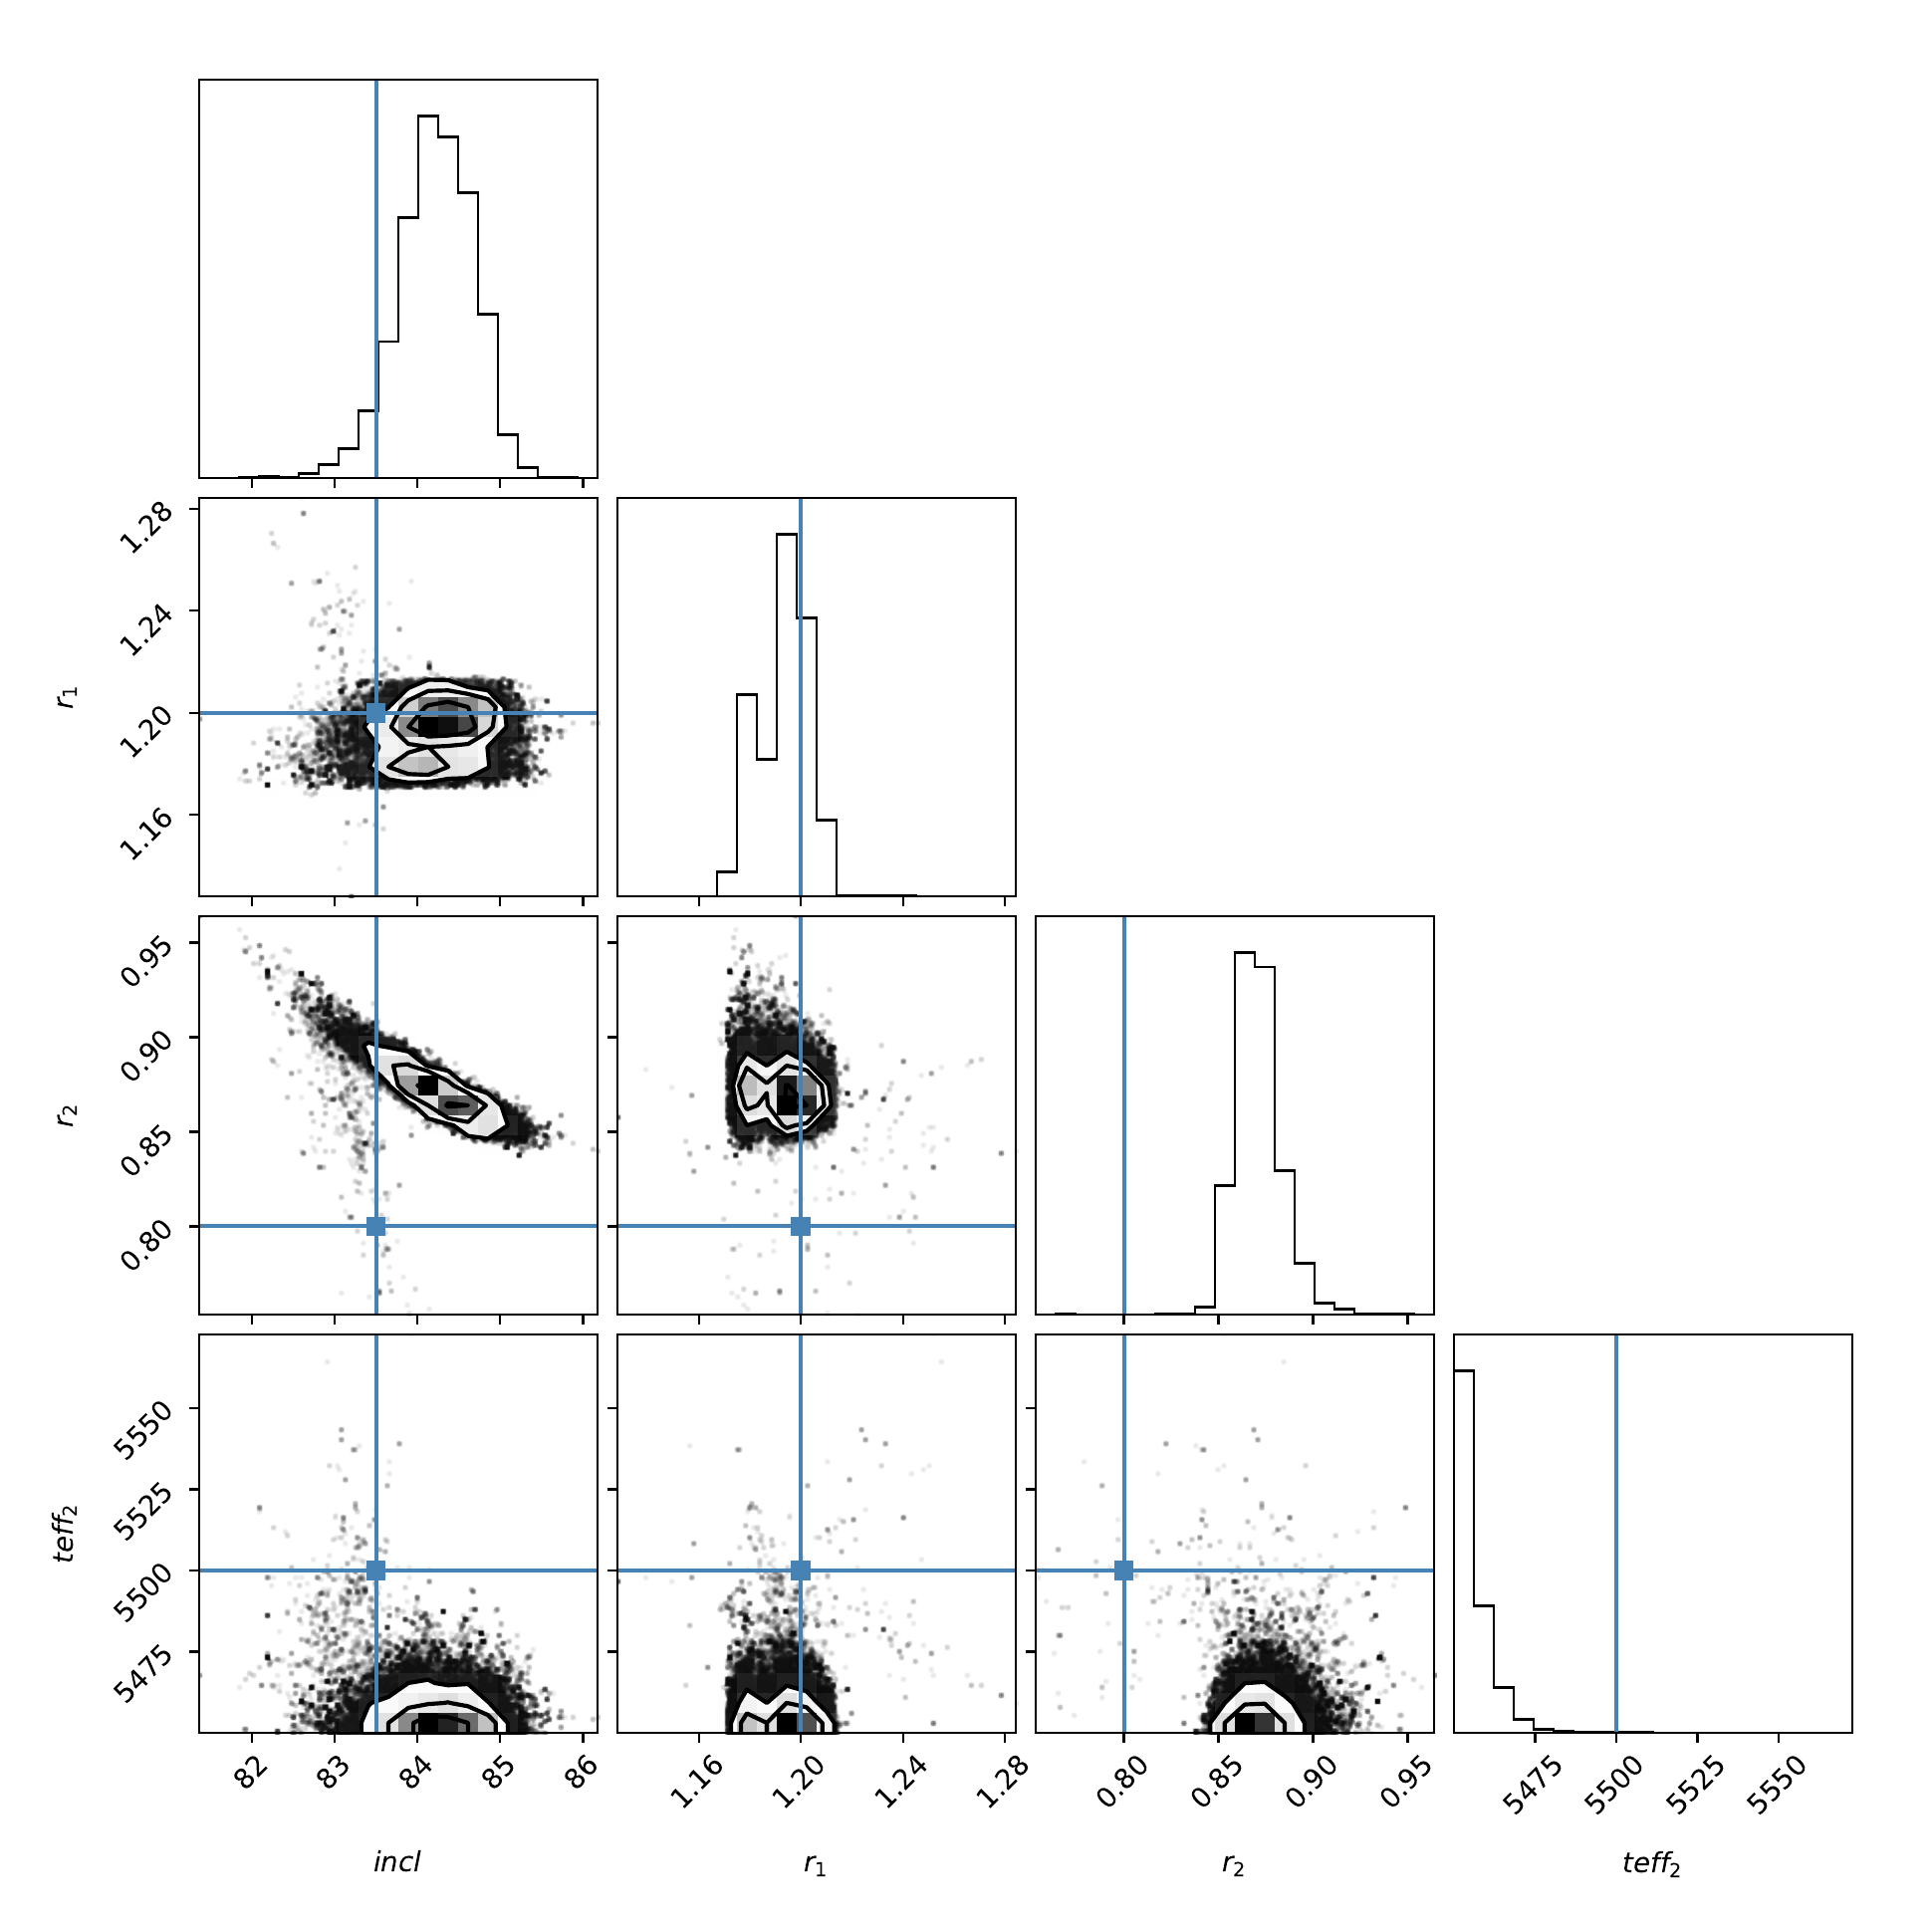
Corner plot showing posterior distributions and parameter correlations from the MCMC analysis. True values are marked with blue lines.#
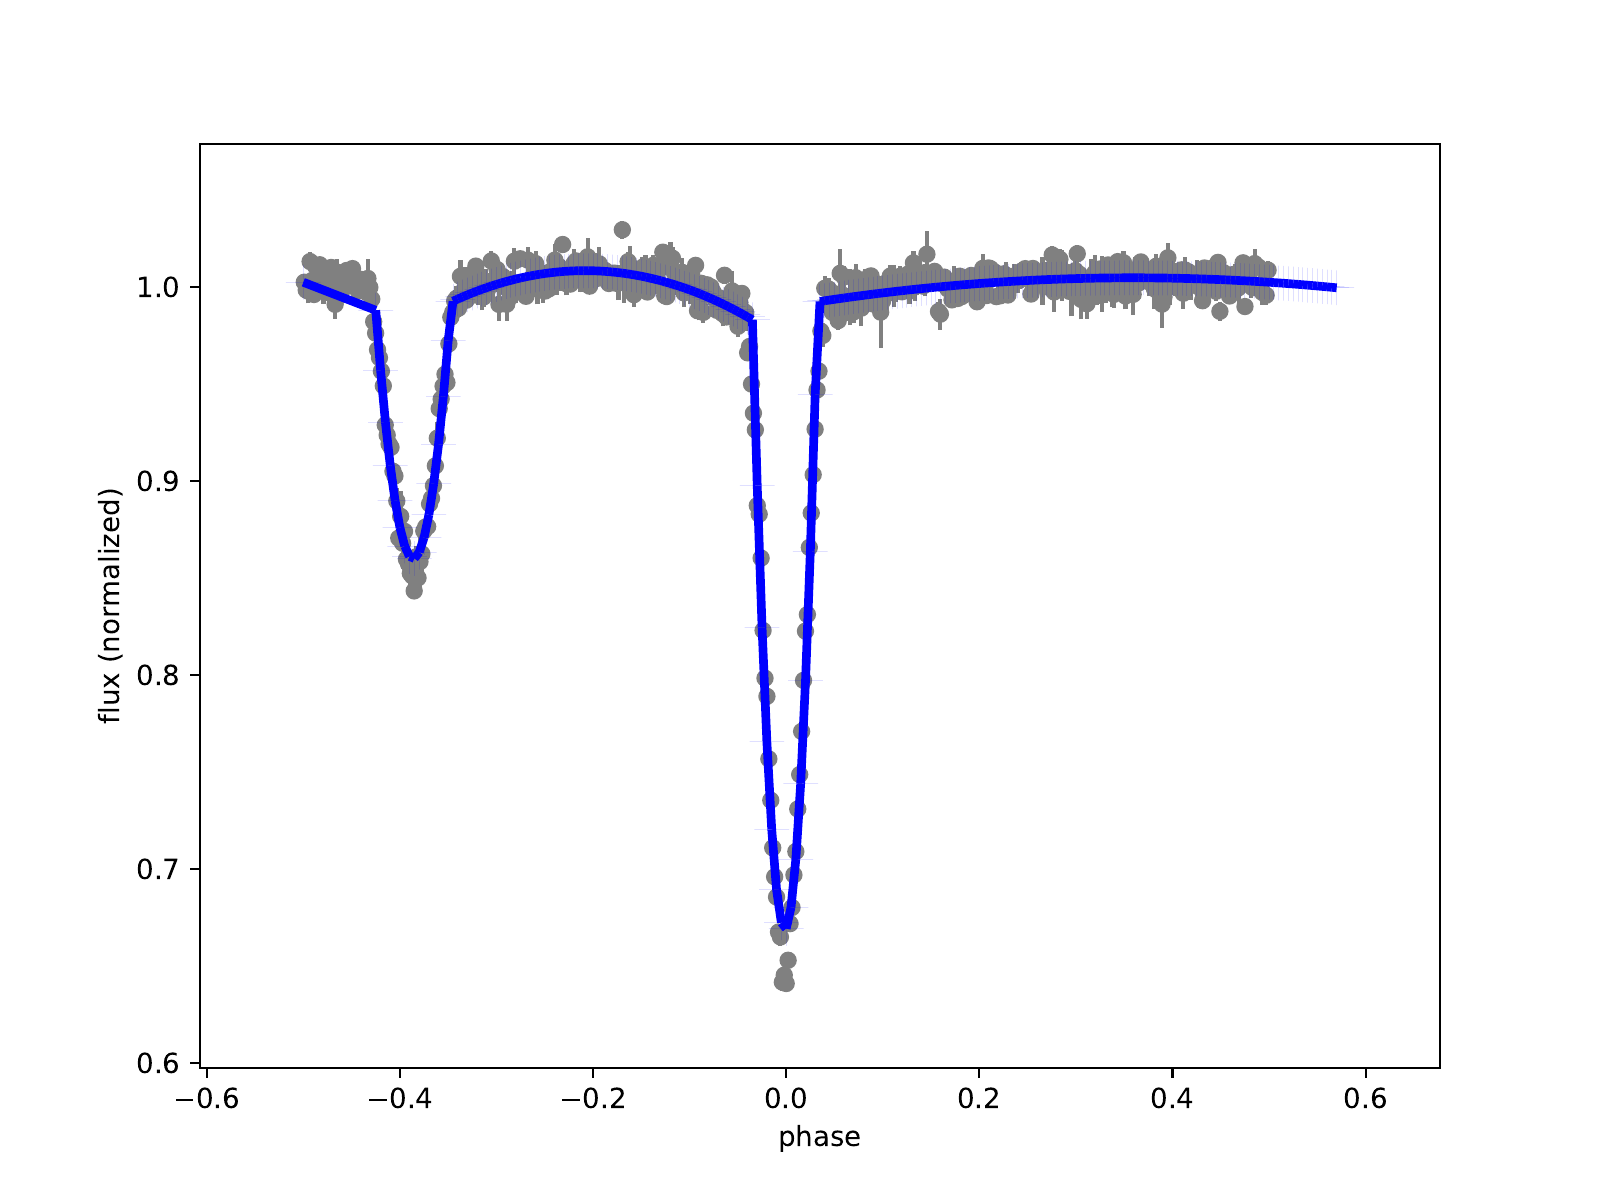
Model Fit#
The fit plot overlays MCMC sampled models on the observed data, demonstrating convergence to the true system parameters.
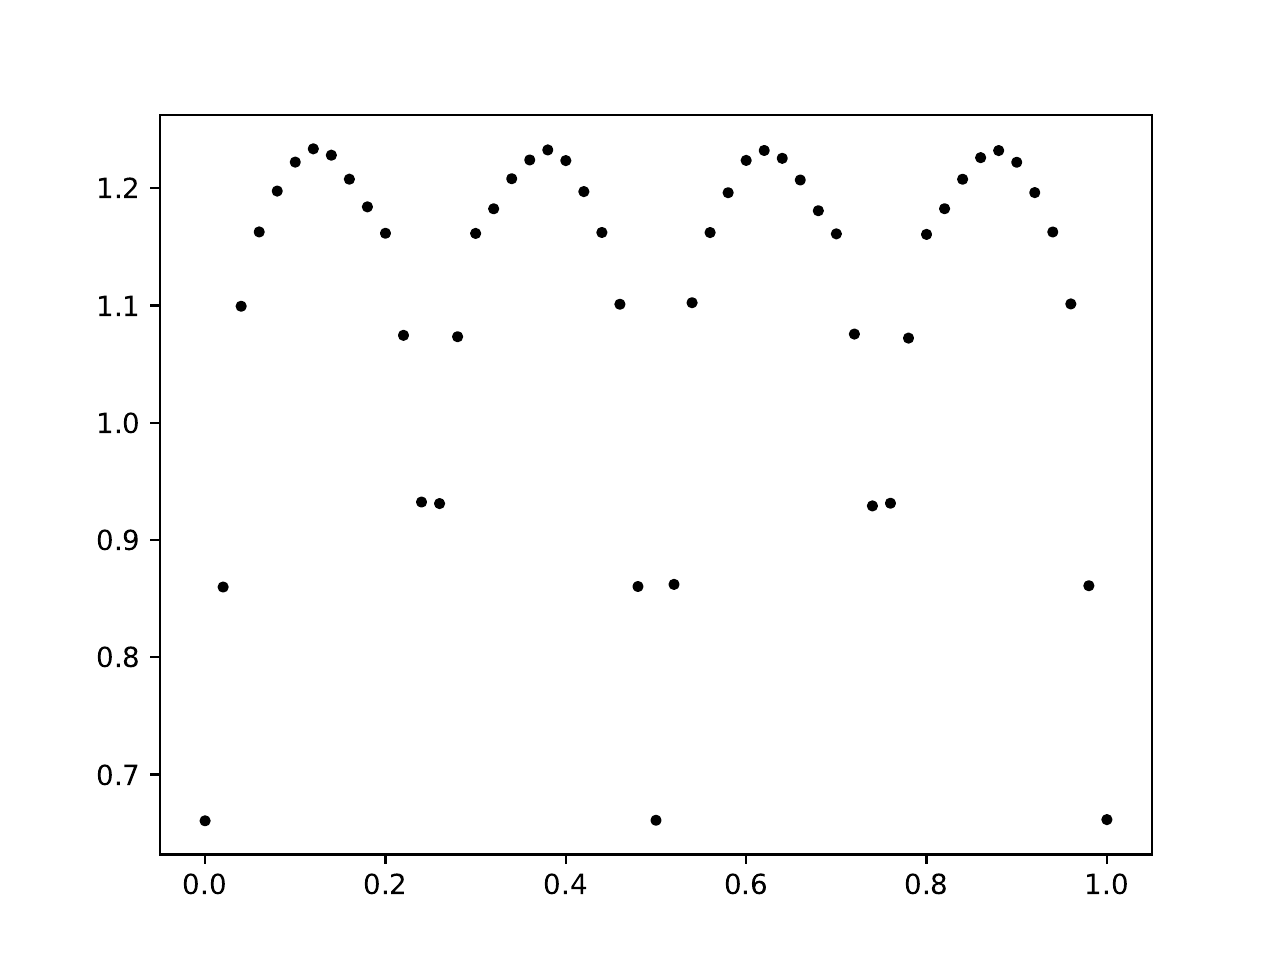
MCMC fit results overlaid on the simulated light curve data.#
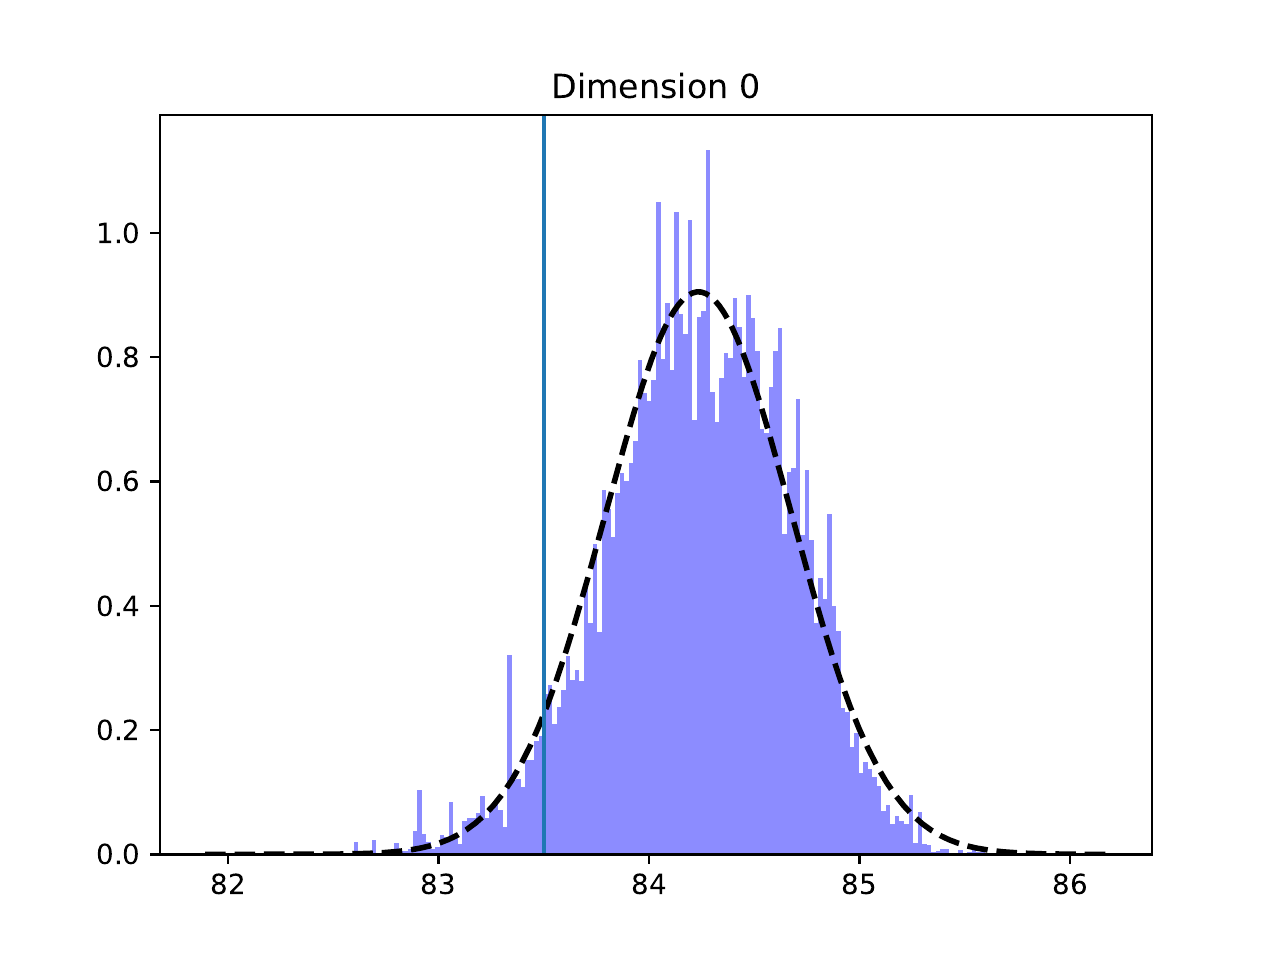
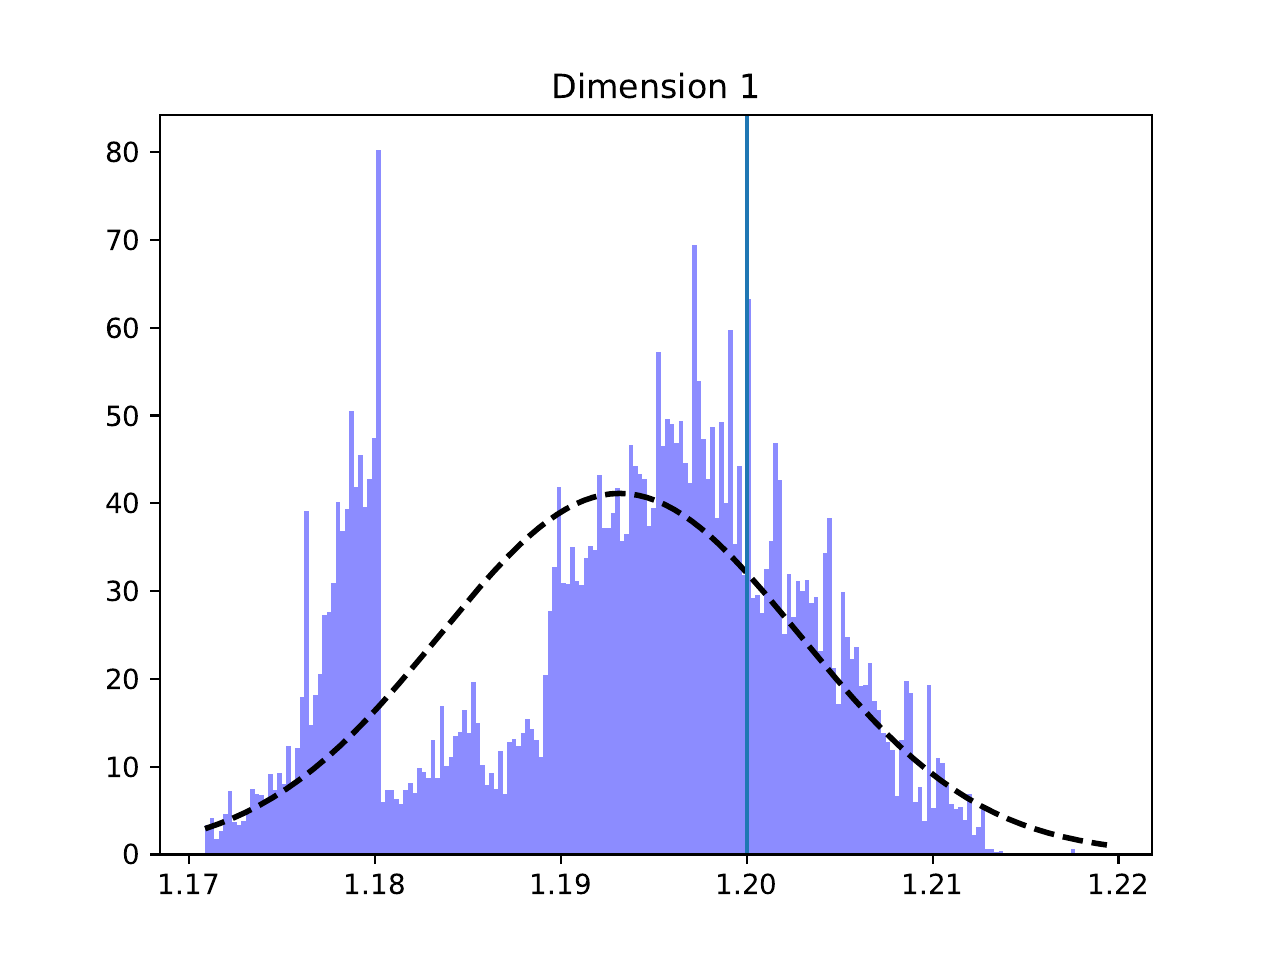
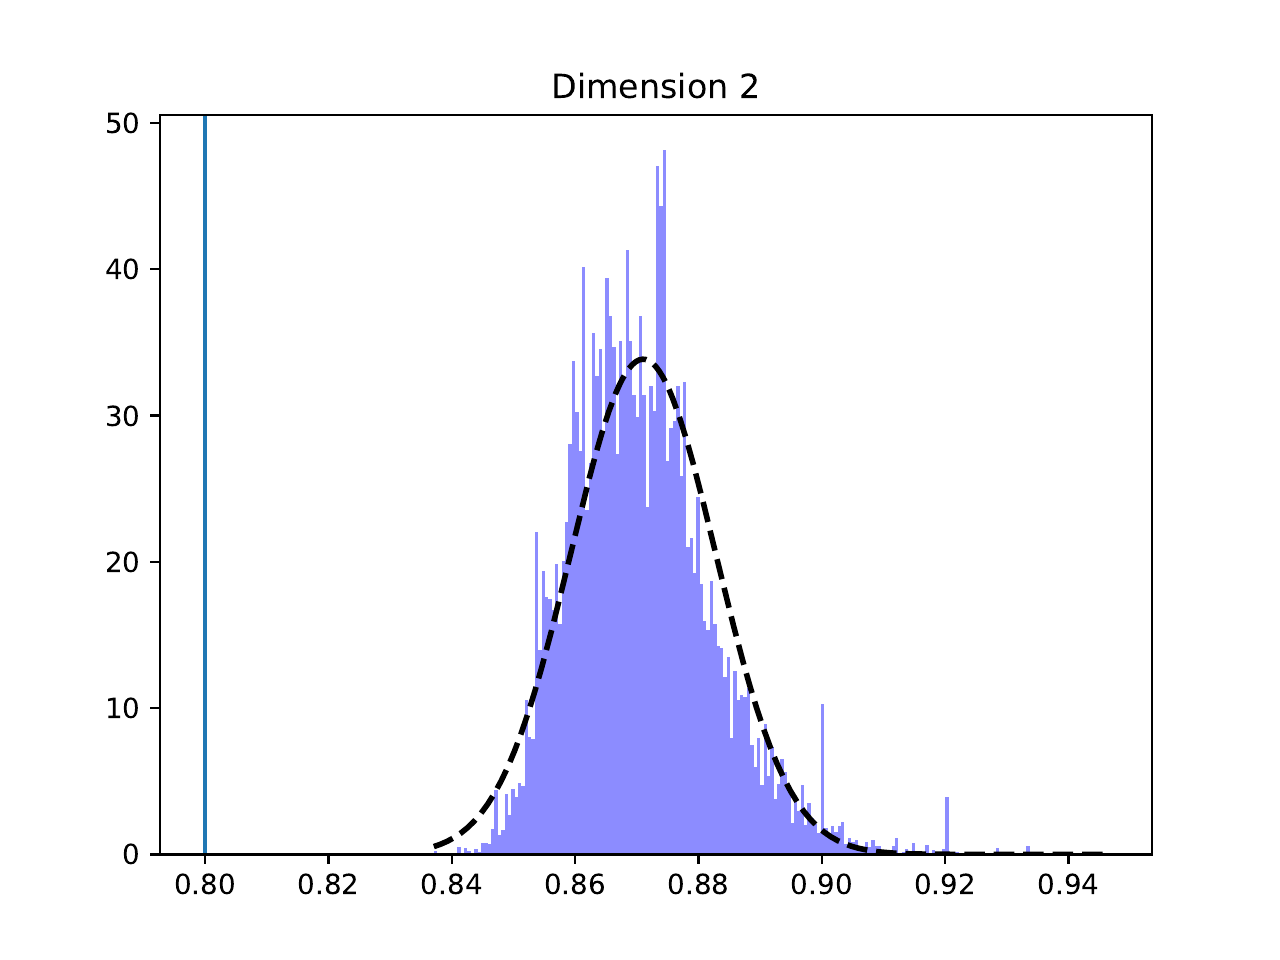
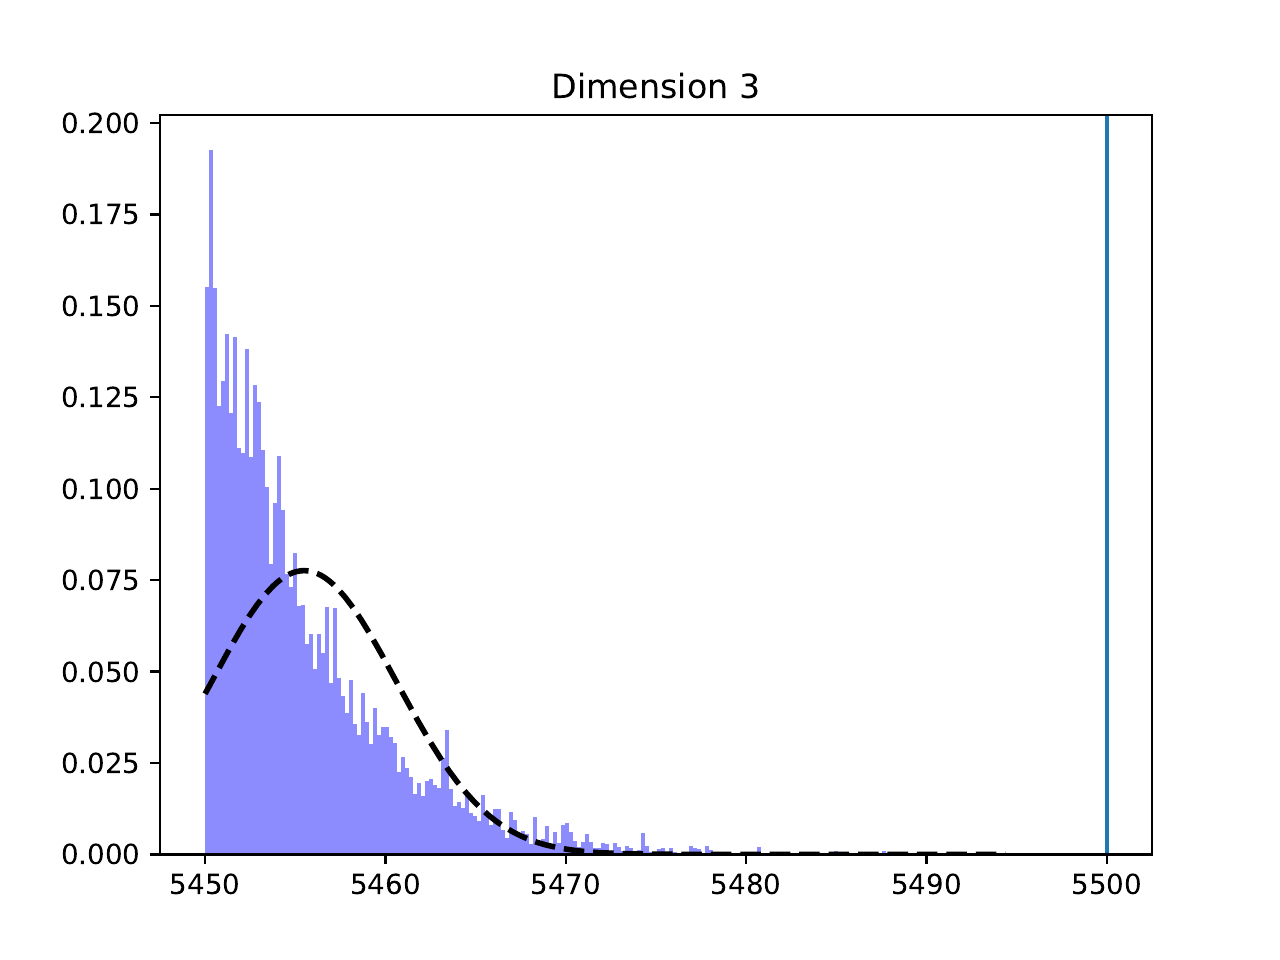
Parameter Distributions#
Individual parameter histograms with Gaussian fits, showing the recovered values for each system parameter:
Code Highlights#
MCMC Probability Function
The core of the fitting process is the log-probability function, which combines prior constraints with a chi-squared likelihood:
def lnprob(model_params, sigma_arr):
    """Calculate the log-probability for a set of model parameters."""
    # Set PHOEBE bundle parameters
    c['incl@binary@orbit@component'] = model_params[0]
    c['requiv@primary@star@component'] = model_params[1]
    c['requiv@secondary@star@component'] = model_params[2]
    c['teff@secondary@star@component'] = model_params[3]

    # Check priors (uniform)
    lnp = lnprior(priors, model_params)
    if not np.isfinite(lnp):
        return -np.inf

    try:
        c.run_compute()
        chi2 = 0.
        for dataset in c.get_model().datasets:
            chi2 += np.sum(
                c.calculate_residuals(dataset=dataset, as_quantity=False)**2
                / sigma_arr**2
            )
        return -0.5 * chi2 + lnp
    except:
        return -np.inf
Download#
Download PHOEBE Research Summary (PDF)