Legislative & Economic Data Visualization#
Python Plotly Pandas Selenium NumPy
02/2023
Overview#
Data analysis and visualization of U.S. economic indicators alongside legislative activity from 1953 to 2022. The project combines web-scraped economic data with a comprehensive dataset of over 25,000 laws to explore relationships between legislation and economic trends.
Acquired economic indicator data by developing a web scraper using Python and Selenium
Cleaned, processed, and analyzed data from multiple sources using Pandas
Created interactive Plotly visualizations combining legislative counts with economic indicators
Analyzed unemployment rates, inflation, and GDP growth alongside legislative output
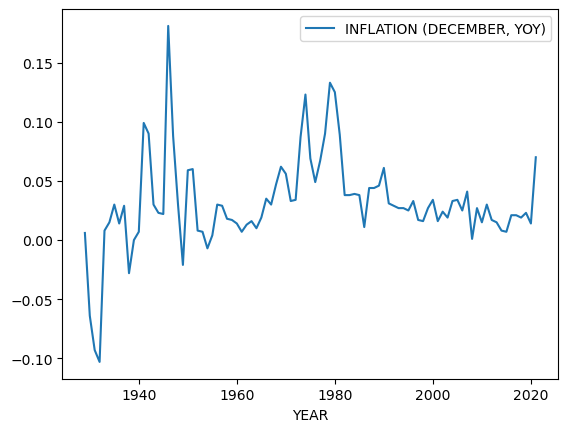
Legislative activity plotted alongside economic indicators.#
Interactive Visualization#
The chart below is an interactive Plotly visualization. Hover over data points to see values, and use the controls to zoom and pan.
Methodology
Data Sources:
U.S. legislative records (1953–2022): 25,000+ laws with names and dates
Historical unemployment rates spanning 93 years
Inflation and GDP growth indicators
Processing Pipeline:
Scrape economic data from government sources using Selenium
Parse and clean legislative records from Excel datasets
Merge and align time-series data across sources
Generate interactive multi-axis visualizations with Plotly
Automated Data Collection#
The legislative dataset was gathered using a custom Selenium web scraper that navigates Congress.gov search results, extracting law titles and descriptions across 25,000+ records.
Scraper Source Code
import pandas as pd
from selenium import webdriver
from selenium.common import TimeoutException, NoSuchElementException
from selenium.webdriver.firefox.service import Service
from selenium.webdriver.common.by import By
from selenium.webdriver.support import expected_conditions as EC
from selenium.webdriver.support.ui import WebDriverWait
from webdriver_manager.firefox import GeckoDriverManager
from timeit import default_timer as timer
import time

start_timer = timer()

BASE_URL = 'https://www.congress.gov/u/qfqynCbSYlZHeuZXDIwFu'

def main():
    try:
        driver = webdriver.Firefox(
            service=Service(executable_path=GeckoDriverManager().install())
        )
        df = pd.DataFrame(columns=['Titles', 'Description'])

        driver.get(BASE_URL)
        while True:
            try:
                search_container = driver.find_element(By.ID, 'main')
                search_results_title = search_container.find_elements(
                    By.XPATH,
                    "//li[@class='expanded']//span[@class='result-heading']"
                )
                search_results_description = search_container.find_elements(
                    By.XPATH,
                    "//li[@class='expanded']//span[@class='result-title']"
                )

                titles = {
                    'Titles': [r.text for r in search_results_title]
                }
                description = {
                    'Description': [r.text for r in search_results_description]
                }
                titles.update(description)

                df = pd.concat(
                    [df, pd.DataFrame.from_dict(titles)], ignore_index=True
                )
                df.to_excel('law_names.xlsx', engine='openpyxl', index=False)

                try:
                    next_button = driver.find_element(
                        By.XPATH,
                        "/html/body/div[2]/div/main/div/div/div[2]/div[2]/div[2]/a/i"
                    )
                    next_button.click()
                    time.sleep(5)
                except NoSuchElementException:
                    break

            except:
                break

    except TimeoutException:
        print("Timed out waiting for data")
    except NoSuchElementException as e:
        print(e.msg)
    finally:
        df.to_excel('law_names_final.xlsx', engine='openpyxl', index=False)
        print(f'Number of titles found: {len(df)}')
        driver.quit()

if __name__ == "__main__":
    main()
Technologies#
Category |
Tools |
|---|---|
Data Processing |
Pandas, NumPy |
Web Scraping |
Selenium |
Visualization |
Plotly |
Data Sources |
Excel, CSV |